With the Line element, you can make a chart of your datasource.
 You can use the Bind to data tool to select your datasource.
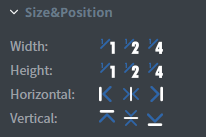
 In the Size&Position menu, you can select the width, the height, and the placement of your element quickly.
Click here for more information about using size and position.
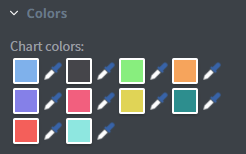
In the Behaviour menu, you can set the spacing and the depth of your chart. In the Colors menu, you can set the colour of the lines individually.
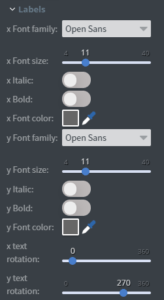
 In the Labels menu, you can select the font family, size, and style of your bar labels on both axis.
You can set the text rotation as well to both axis.
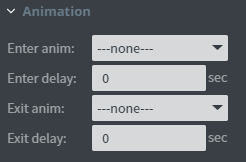
 In the Animation menu, you can choose the enter and exit animation of your element.
Click here for more information about using animations.
