
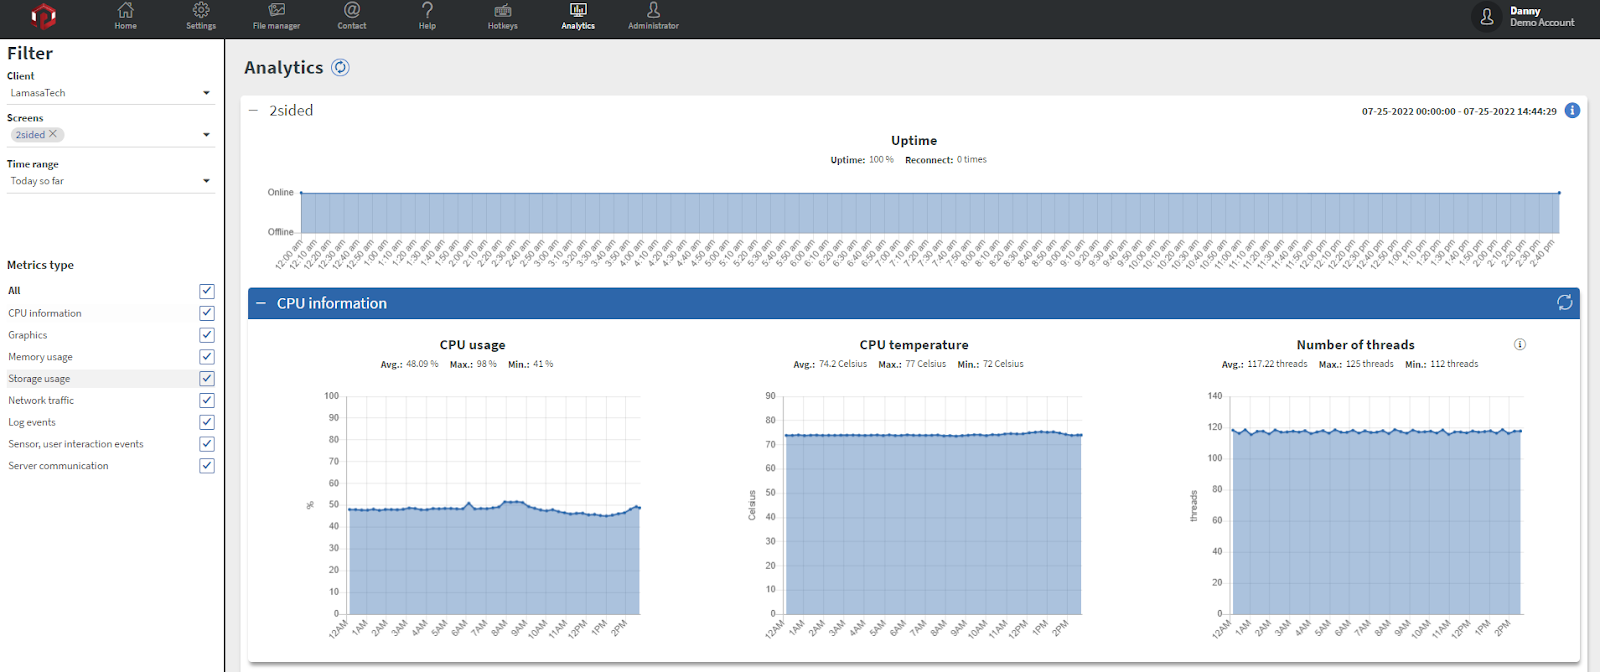
In the Device Analytics menu, you can see hardware, network, and more information about your devices in graphs.
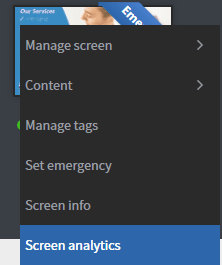
You can reach the Analytics tab by clicking the Analytics button on the horizontal menu. Or you can open the context menu of a device and select the Screen analytics option.
Devices upload a data set of their analytics every 30 min. In the Filter section, you can set filters to show the data you want. Administrators can change between Clients and can see other’s devices.
The Load screen only with data slidebox allows you to filter out devices without uploaded data. In the Screens filter, you can select the device you want to check. You can select more than one at a time.
In the Time range filter, you can select pre-made intervals. You can also add a Custom time interval. Device Analytics will only show data from the selected time interval.
In the Metrics type filter, you can select what type of data you want or do not want to see in the analytics. After you set everything you wanted, the correct data will appear in graphs. You can refresh the data of graphs in each section by pressing the Refresh button.
