Connecting data sources
You can connect different types of external data sources to our system. Right now, supported types are:
- Json (advised in most cases)
- XML
- Google Sheets
- ICal calendars (Google, Apple, etc.)
- NodeJS scripts (uploaded to our system)

Navigate to the “Settings” menu, locate “Datasources” and click “Add new”. You can either create a new Google Sheet or click “Use existing URL” in any other case. The URL can be anything that can be accessed from your server (localhost, internal network, www) and is or returns a supported type. For example, your data source URL can be something like this:
https://www.example.com/myDatasource.JSON
In this case, the “Type” will be JSON. Set the “Refresh” time according to how often your data usually changes and how quickly you need your content to show the change. If everything is set up correctly, after clicking on the “Preview” button, you will see your data.
Using a Google Sheet in a content
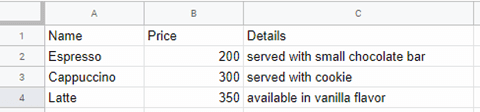
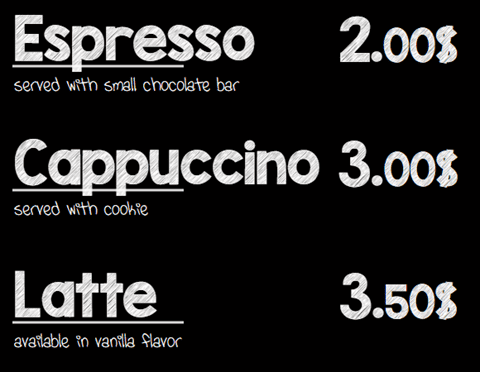
Google Sheets are limited but easier to use. Type the column names into the first row and the details below them row by row. For example, if you’re creating a cafe coffee menu, your column names can be Name, Price, and Details. The rows will then contain the different available coffees as seen in the below image.
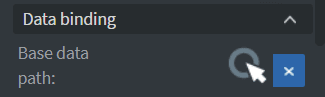
Create and open a new content then locate the “Content” section in the left-hand menu. Click on the “Base data path” button.
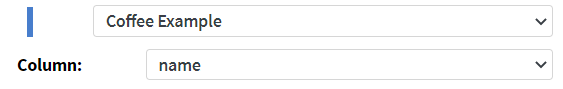
Select your data source and the column with a unique identifier. In this case, this will be Name.
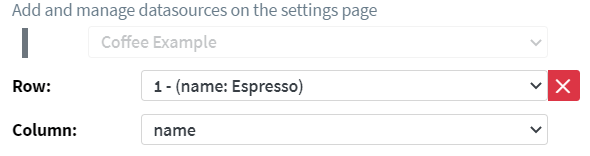
Add a “Text” widget but instead of typing in your text, select it by clicking on the appearing widget and locating the “Other” tab in the left-hand menu. Click on “Bind to data”. You can also access this menu by holding Shift and double-clicking on your text widget.
Choose one of your fields, in this case, we chose the Name field from the first row. Because we set up a base data source first, we only need to choose the “Row” and the “Column”.
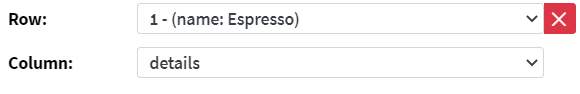
Now we can add two more text widgets for the price and the details.
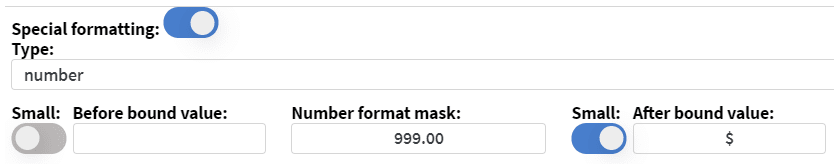
The price is tricky because we have 300 in our datasheet, but we want to display $3.00. We can achieve this by turning on “Special formatting” at the bottom of this popup window.
The Number format mask reads both the input and mask starting from the last character. All the 9’s and 0’s will be replaced by the corresponding digit. Any other character in the mask will be added to the indicated position. 0’s will be displayed in a smaller size. If the input is longer than the mask, the first digit of the mask will be repeated. “9.00” will display any price with big numbers, a dot and the last two digits as smaller numbers, “9999999.00” would do the same. A phone number can be displayed with a mask such as +99/99 999 99-99.
Also, note that choosing the 1st row means whatever is in the 1st row will be shown even though there is a hint (name: Espresso) next to it for easier setup. Hence, if you add Latte macchiato instead of Espresso into your first row, the content will show that instead. Or, if you change the price of Espresso the content will reflect that.
You can apply any text formatting you could to a normal “Text” widget using the right-hand menu.
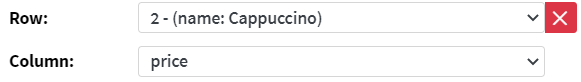
You can copy and paste everything and select different rows. When a widget has a bound data source, double-clicking will automatically open the data binding popup.
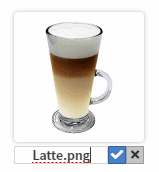
You can also bind images. For this to work you need to upload an image with the exact same name as one of your data fields (or rename it after uploading). You can open the “File” popup by double-clicking on an “Image” widget or pressing Alt+M.

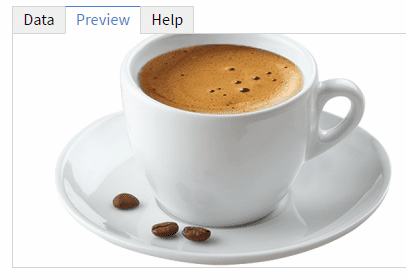
Add an “Image” widget and open the “Bind to data” popup. We can choose 1/name for the image, the same one we chose for the text widget. On the “Data” tab, we will see the same “Cappuccino” text but if we click on “Preview”, the image will appear.
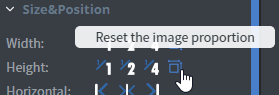
If your image’s proportions are distorted, use the “Reset image proportions” in the left-hand menu.
You can use Google Sheets with any other widget discussed later in this documentation.
Using JSON/XML data sources in contents
(Please read the above Google Sheet section first!)
While Google Sheets are always a fixed depth (a table), custom data sources can be deeper. For example, an electronics store’s database will have products (let’s say, TVs) and every TV will have simple data fields such as name, price, previous price, number of HDMI inputs, etc. Each of them can also have a table of all the different features as key-value pairs or even a similar array.
Create a“New content”. You can either use the demo data source provided with this guide (TODO) or your own data source. In the “Page” section, click on “Base data path”. This time, the popup will be a bit different.
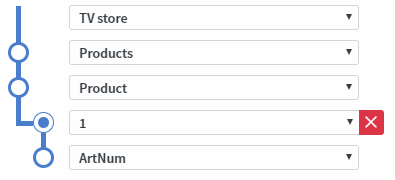
First, we need to select our unique identifier. For this store, it will be the ArtNum field.
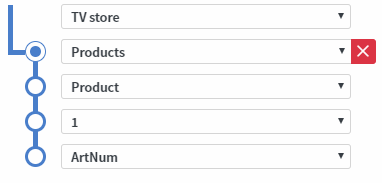
Now we can adjust our “Pivot point”. It must be on the level where our main entities are (e.g. products, employees, meetings, etc). In this case, these are the products which we store in an array. Every product has an ArtNum, Name, Price, etc. We need to put the pivot point to the level “above” the recurrent part. As a rule of thumb, if we have an array of the things we want to display, the “Pivot point” will be at the array’s level.
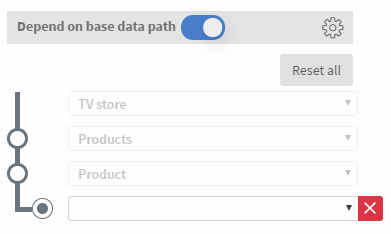
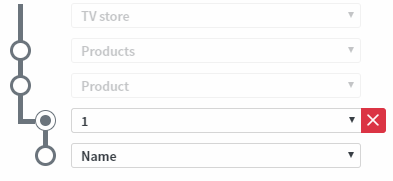
Add a “Text” widget and open the “Bind data source” popup. The path selection block will be half-filled. If we need to bind this widget to a different data source (or a different part of the same one), uncheck “Depends on base data path”. In any other case, it is advised to keep your widgets dependent.
Choose a field to be displayed in the “Text” widget.
Try it out
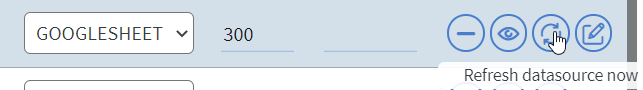
Open the preview of the content in your browser or send it to a media player. Change something in your data source that is currently visible on your screen. If we change the price of Latte to 385 from 350, the next time the data source is refreshed, it will automatically update in your content as well. This depends on the refresh time set in the “Settings” menu. You can also click the refresh button next to your data source on “Settings”. This approach can be useful if your data rarely changes but you want the changes to apply quickly. (E.g. weekly menu in a restaurant.)